

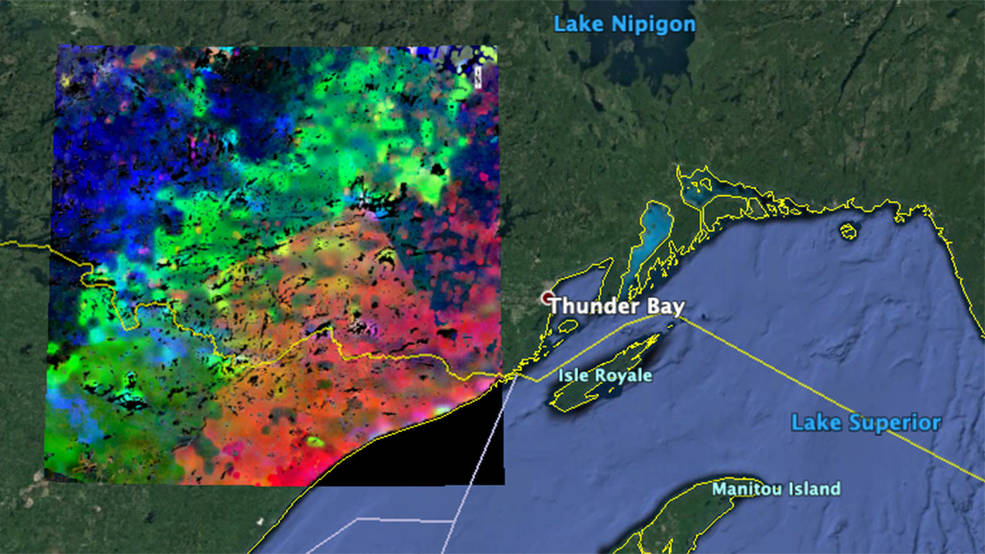
Plants “waking up” near Lake Superior. Red areas wake up at around 7 a.m. local time; green areas around 8 a.m.; and blue areas, at about 9 a.m. The data was acquired by ECOSTRESS during the summer season.
Credits: NASA/JPL-Caltech
Over the last few months, we’ve been using satellite data to develop products that measure Evapotranspiration – this is the total loss of water from the soil and plants through the two processes of evaporation and transpiration. Evaporation is the loss of surface water to the air, whereas transpiration is the loss of water the plant gives off in water vapour through pores in their leaves -called stomata.
We’re developing the product for the two International Partnership Programmes, funded through the UK Space Agency, that we’re involved in Uganda and Colombia. We’ve been working with the Potential and Actual Evapotranspiration. Potential evapotranspiration is effectively the loss of water to the atmosphere through evaporation and transpiration assuming no control on water supply, whereas actual evapotranspiration is, obviously, the amount of water actually lost due to evaporation and transpiration. Ratio’s of these two measurements can be used to produce crop stress indicators and help identify where plants are suffering from a lack of water.
We were excited to see a report last week where NASA was using evapotranspiration to show how plants ‘wake-up’ as plants have circadian rhythms like humans. During the day plants are more active and they get rid of excess water, or sweat if you like, through evapotranspiration, whereas at night they are much less active.
Scientists have used evidence of evapotranspiration to monitor when plants have woken up using data collected by the ECOsystem Spaceborne Thermal Radiometer on Space Station (ECOSTRESS) to produce images like the one at the top. It shows plants waking up west of Lake Superior near the U.S.-Canada border. The red and pink areas began to awake at around 7 a.m. local time., whereas the green areas awoke closer to 8 a.m., and blue areas, closer to 9 a.m. This image was created using data across a summer season.

The ECOsystem Spaceborne Thermal Radiometer Experiment on Space Station (ECOSTRESS), pictured at the bottom, and the Latching End Effector (LEE), pictured at the top, are integrated into the unpressurized SpaceX Dragon truck June 2, 2018, at the SpaceX facility on Cape Canaveral Air Force Station in Florida. Photo credit: SpaceX and NASA.
ECOSTRESS is attached to the outside of the International Space Station. It was taken up the station on a SpaceX Falcon 9 rocket on 29th June 2018 and was fitted to its outside in early July 2018. ECOSTRESS uses Prototype HyspIRI Thermal Infrared Radiometer (PHyTIR) measure evapotranspiration. This radiometer has six spectral bands, with five in the 8-12.5 μm waveband range and an additional band at 1.6 um for geolocation and cloud detection. Further information can be found about the mission in our blog about its launch.
We‘re not using ECOSTRESS data as its only acquiring data at limited locations. Instead, we use data streams from MODIS, together with the Clouds and the Earth’s Radiant Energy System (CERES) system for solar radiation, as inputs into our solution. We have been focussing on monthly and daily evapotranspiration products but what time plants get up in the morning has certainly got us thinking about how we might be able to evolve our products in the future.
