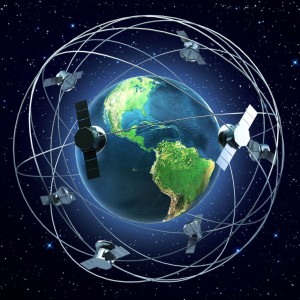
Last month we looked at how satellites are currently orbiting the planet, and this week we’re going to focus on the number of Earth Observation (EO) satellites at the start of 2023. This uses the database from the Union of Concerned Scientists (UCS) whose recent update lists the active operational satellites on the 31st December 2022. As we saw last month, it indicated that there were 1,192 satellites active on that date that had the main purpose of EO or Earth Science.
According to the UCS, there were 1,052 EO or Earth Science satellites in orbit at the start of 2022, meaning a 13.31% increase during the year. It is, of course, acknowledged that multiple EO or Earth science satellites have been launched during 2023 and so the actual number of active satellites will be slightly higher, but for the rest of blog we’re going to use the figures from the start of the year.
What do Earth observation satellites do?
Whilst the 1,192 satellites we are looking at have a purpose of EO or Earth Science, there are further details on their specific roles, which shows that there are:
- Optical Imaging: 480 satellites: an increase of 12.68% during the year.
- Meteorology: 179 satellites: an increase of 5.29%.
- Earth Observation: 119 satellites (no detailed purpose listed): an increase of 50.63%.
- Electronic intelligence: 116 satellites: an increase of 2.65%.
- Radar imaging: 113 satellites: an increase of 25.56%.
- Earth Science: 75 satellites: no change.
- Hyperspectral/Multispectral imaging: 43 satellites: an increase of 4.88%.
- Other purposes: 26 satellites: an increase of 52.94%.
- Automatic Identification System (AIS): 22 satellites: an increase of 15.79%.
- Infrared imaging: 12 satellites: no change.
- Video: 7 satellites: a decrease of 30%.
Optical imagery is still the largest type of EO satellite in orbit, representing just over 40% of the fleet. Although, it should be noted that some of the satellites have multiple purposes. The significant increase in other simply demonstrates the breadth of applications that are being launched as within this grouping are purposes specified as AI/remote sensing, maritime observation, signals intelligence, subsurface imaging and technology development.
Who controls the EO satellites?
There are 237 organisations registered as operating EO satellites, an increase of 8.22% on the start of year. Of these, although 119 control only one satellite; another 46 organisations control two satellites, 17 operate three satellites and 9 operate four. Whereas the top operators control just over half of the world’s active EO satellites, with 52.27%, and these operators are:
- Planet Labs Inc with 195 satellites.
- Spire Global Inc with 126 satellites.
- Chinese Ministry of National Defense with 98 satellites.
- Chang Guang Satellite Technology Co. Ltd. With 53 satellites.
- America’s National Reconnaissance Office (NRO) with 31 satellites.
- Satellogic S.A. with 29 satellites.
- Russia’s Ministry of Defense with 23 satellites.
- ICEYE Ltd with 20 satellites.
- Indian Space Research Organization (ISRO) with 19 satellites.
- China National Academy of Sciences (CNSAS) with 18 satellites.
There are a number of commercial companies in the top operators’ list:
- Planet & Spire Global are American companies.
- Chang Guang Satellite Technology Company is a Chinese company.
- Satellogic is an Argentinean company
- ICEYE ltd is a Finish company.
Where are the Earth observation satellites launched from?
The top five launch sites for these active satellites, which account for over 60% of the launches, are:
- Cape Canaveral in the United States which has launched 230 satellites.
- Satish Dhawan Space Centre in India which has launched 157 satellites.
- Jiuquan Satellite Launch Center in China which has launched 132 satellites.
- Taiyuan Launch Center in China what has launched 119 satellites.
- Vandenberg Air Force Base in the United States which has launched 98 satellites.
Who uses the Earth observation satellites?
The users for the EO satellites listed by the UCS are:
- 589 satellites are listed as having Commercial users – an increase of 18.99%.
- 327 satellites are listed as having Government users – an increase of 5.48%.
- 244 satellites are listed as having Military users – an increase of 10.91%.
- 32 satellites are listed as having Civil users – an increase of 18.52%.
It should be noted that some of these satellites have multiple users. This shows how commercial satellites are increasing as commercial organisations start to take a bigger share of the market. Commercial organisations tend to favour cubesats as they are cheaper to build and launch, but it also means they have a shorter mission life requiring more frequent replacement than the satellites launched by the larger space agencies such as NASA and ESA.
What are the orbits of the Earth observation satellites?
Of the satellites in orbit:
- 1,127 are in Low Earth Orbits (LEO) equating to 94.55% of all EO satellites.
- 47 are in Geostationary Earth Orbits (GEO) – 3.94%.
- 2 is in a Medium Earth Orbits (MEO) – 0.17%.
- 16 are in elliptical orbits – 1.34%.
What’s next?
The number of EO satellites is continuing to increase, and although they are still dominated by optical imaging, the recent growth area appears to be radar satellites. In the future we might expect to see more hyperspectral satellites and video cameras; the only thing that is certain is the amount of EO data being generated is continuing to grow.


